Metrics
This is work in progress
Monitoring and understanding the performance of your models and requests is crucial for optimizing and maintaining your applications. The Ollama4j library provides built-in support for collecting and exposing various metrics, such as request counts, response times, and error rates. These metrics can help you:
- Track usage patterns and identify bottlenecks
- Monitor the health and reliability of your services
- Set up alerts for abnormal behavior
- Gain insights for scaling and optimization
Available Metrics
Ollama4j exposes several key metrics, including:
- Total Requests: The number of requests processed by the model.
- Response Time: The time taken to generate a response for each request.
- Error Rate: The percentage of requests that resulted in errors.
- Active Sessions: The number of concurrent sessions or users.
These metrics can be accessed programmatically or integrated with monitoring tools such as Prometheus or Grafana for visualization and alerting.
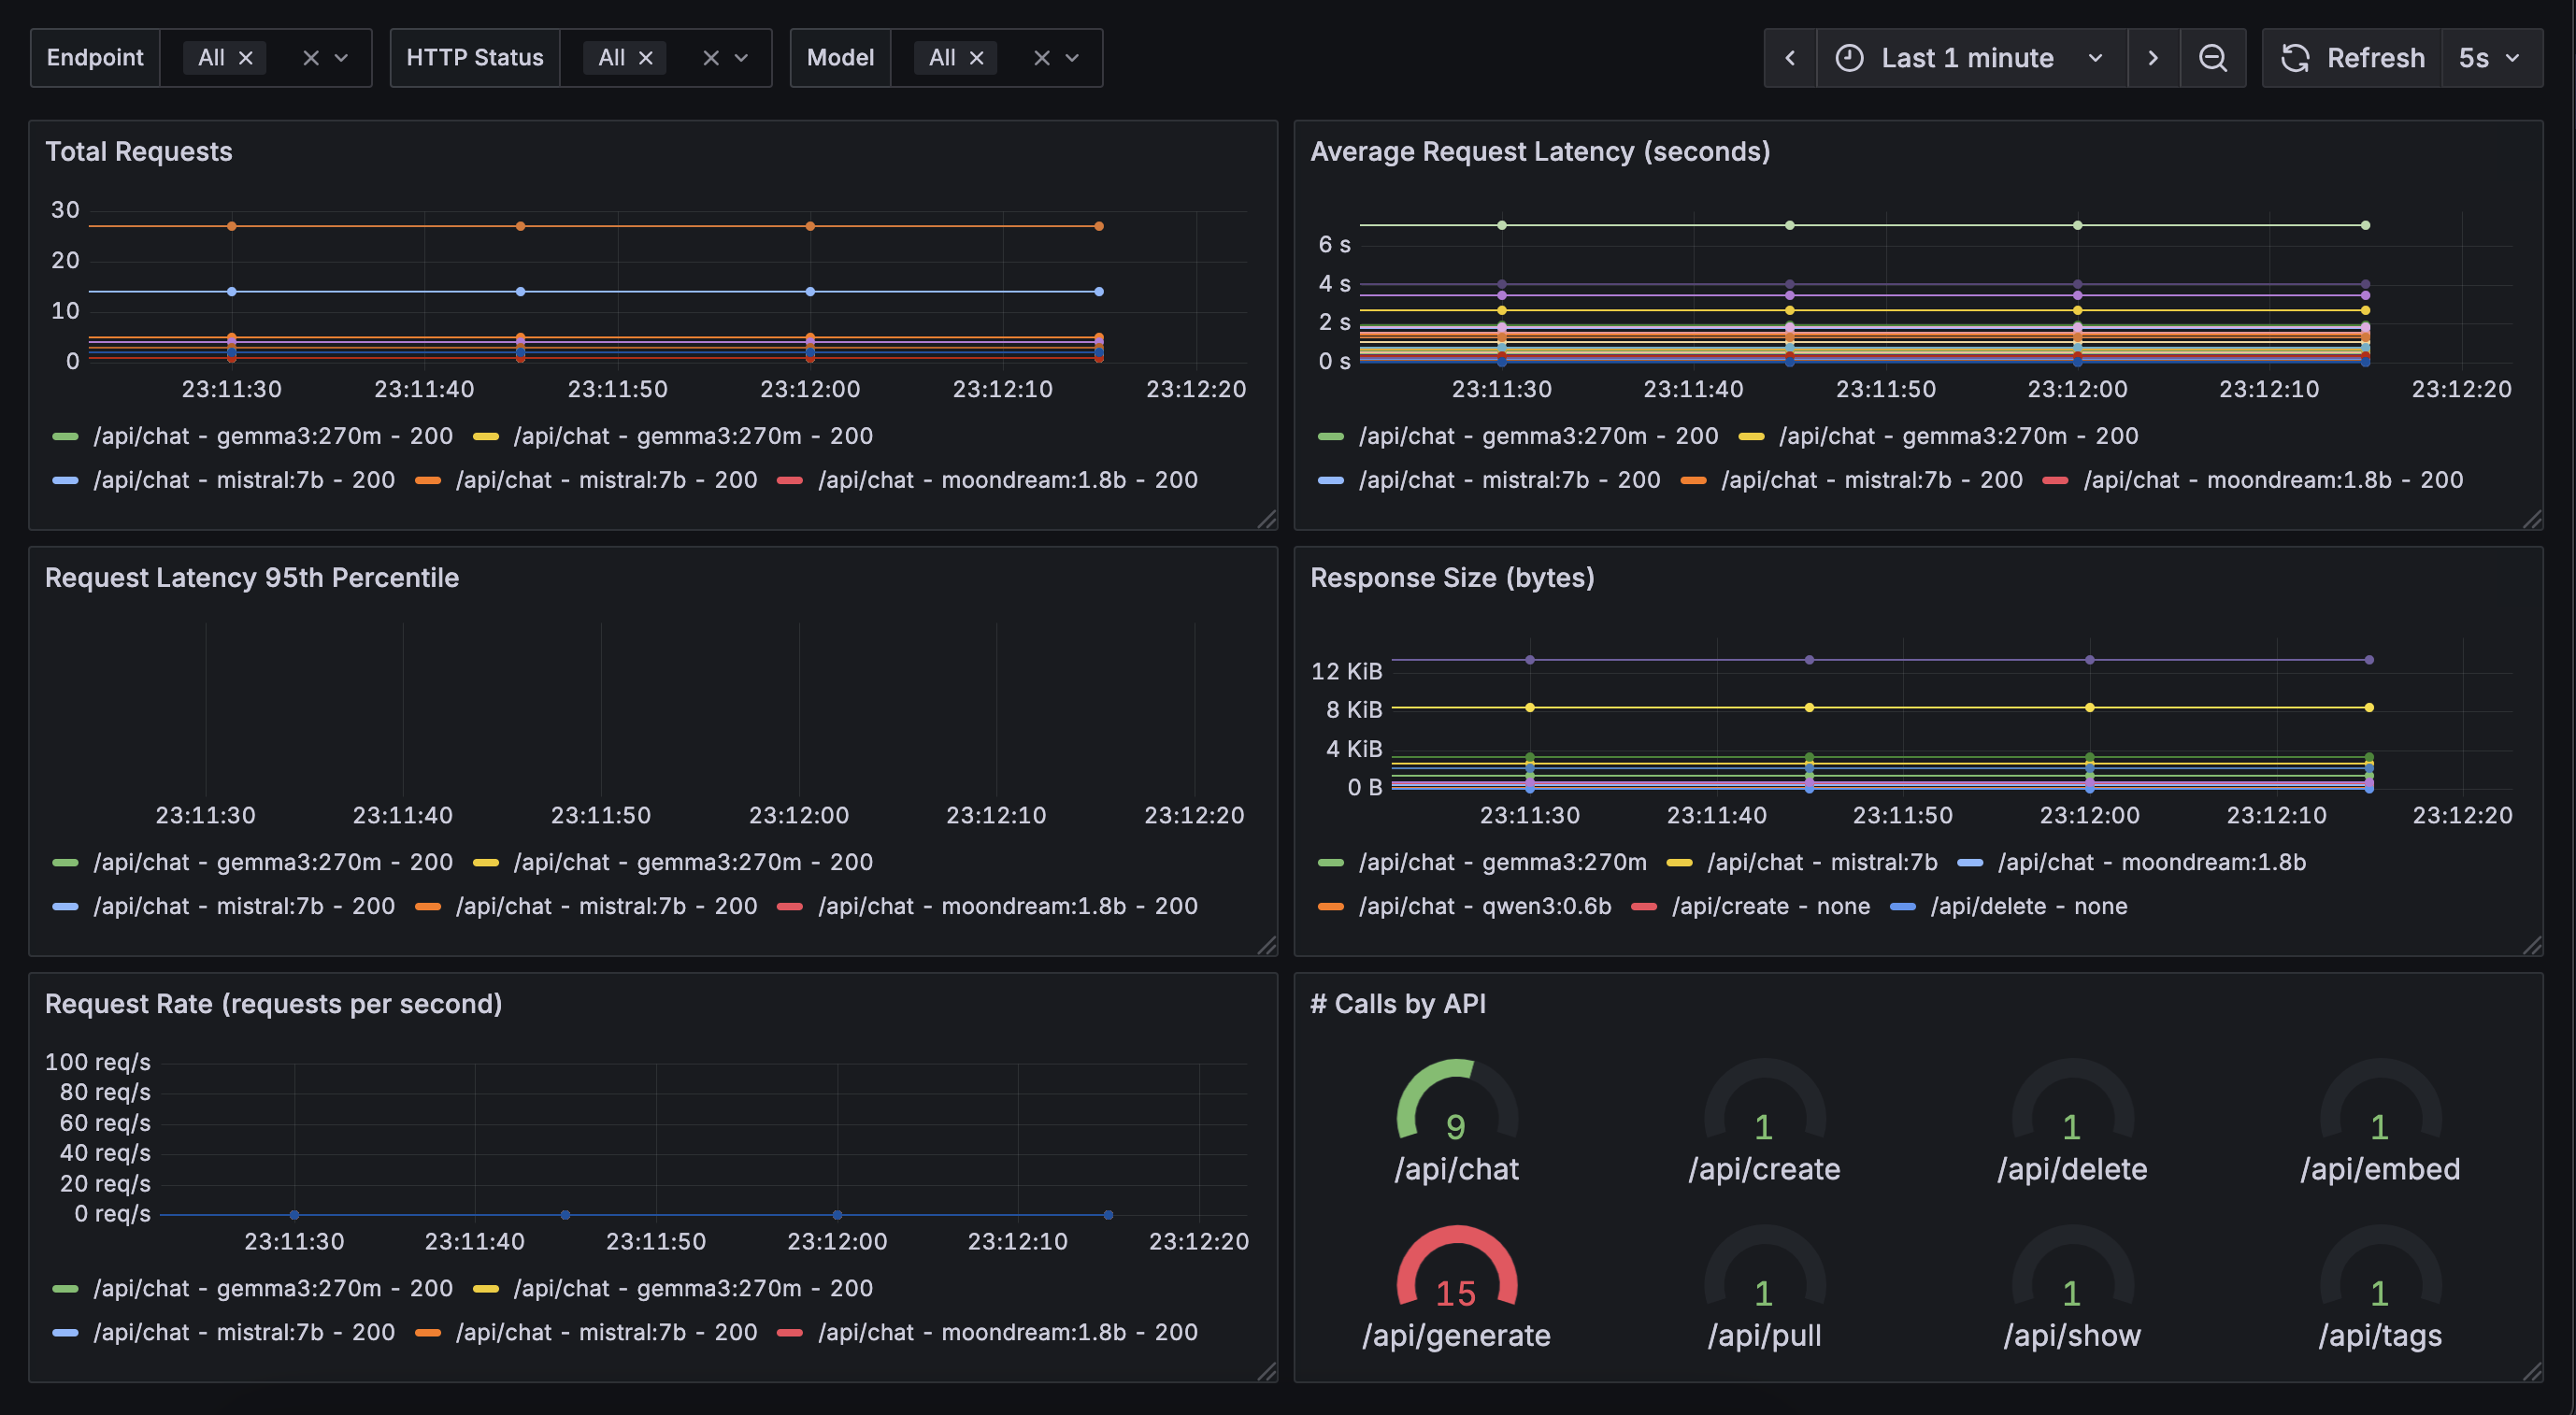
Example Metrics Dashboard
Below is an example of a metrics dashboard visualizing some of these key statistics:
Example: Accessing Metrics in Java
You can easily access and display metrics in your Java application using Ollama4j.
Make sure you have added the simpleclient_httpserver dependency in your app for the app to be able to expose the
metrics via /metrics endpoint:
<dependency>
    <groupId>io.prometheus</groupId>
    <artifactId>simpleclient_httpserver</artifactId>
    <version>0.16.0</version>
</dependency>
Here is a sample code snippet demonstrating how to retrieve and print metrics on Grafana:
This will start a simple HTTP server with /metrics endpoint enabled. Metrics will now available
at: http://localhost:8080/metrics
Integrating with Monitoring Tools
Grafana
Use the following sample docker-compose file to host a basic Grafana container.
And run:
docker-compose -f path/to/your/docker-compose.yml up
This starts Granfana at http://localhost:3000